Modern electrical and industrial environments require better ways to monitor energy consumption, understand equipment performance, and manage operational processes. As facilities become more connected, digital systems can help users collect information and respond to changing requirements. An Energy Management System can support the monitoring and analysis of energy use, while a human machine interface can provide operators with a practical way to view and interact with equipment. Together, these technologies can support applications across manufacturing, commercial buildings, infrastructure, agriculture, and other environments where efficient resource management is important.

Monitoring Energy Consumption in Industrial Facilities
Industrial facilities can contain motors, production equipment, lighting systems, pumps, compressors, and other electrical loads operating at different times. Understanding how much energy different processes consume can help facility teams identify patterns and make informed operational decisions.
An Energy Management System can collect and organise information about energy consumption from different parts of a facility. Depending on the system design, users can monitor parameters such as:
- Electricity consumption
- Demand levels
- Operating patterns
- Energy usage by equipment or area
- Historical consumption trends
This information can help teams understand where energy is being consumed and identify areas that may require further investigation.
Creating a Centralised View of Operations
Large facilities can have numerous machines and electrical systems operating simultaneously. Accessing information from individual machines can become difficult when operators need to monitor several processes at once.
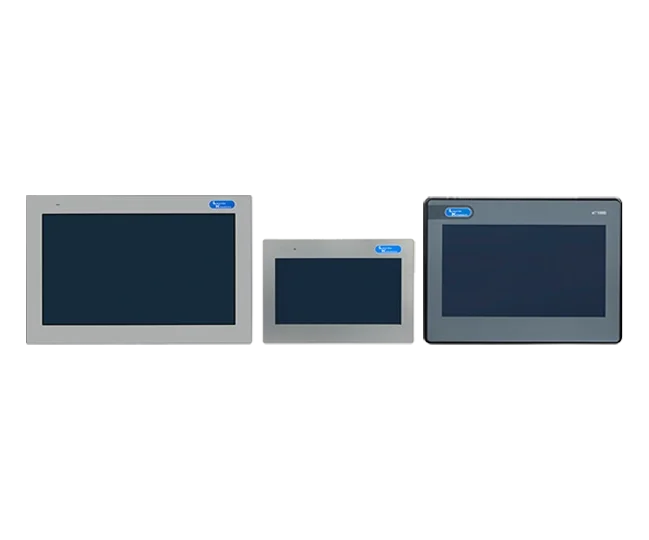
A human machine interface can provide a visual interface through which operators can view selected equipment information. Depending on the application, screens can display operating conditions, status indicators, alarms, measurements, and other relevant information.
Common information displayed can include:
- Equipment status
- Operating parameters
- Alarm notifications
- Production information
- Energy-related measurements
A centralised visual interface can make operational information easier to understand and support quicker identification of unusual conditions.
Improving Energy Awareness in Commercial Buildings
Commercial buildings use energy for lighting, cooling, ventilation, elevators, office equipment, and other services. Consumption can change throughout the day depending on occupancy, weather, operating schedules, and equipment usage.
An Energy Management System can help building teams track energy consumption over different periods. This can provide a clearer understanding of how electricity is being used across different areas.
For example, facility teams can examine:
- Daily consumption patterns
- Peak usage periods
- Energy use by building area
- Changes in consumption over time
- Equipment-related energy requirements
Such information can support planning and help organisations evaluate opportunities for more efficient energy use.
Supporting Machine Monitoring
Industrial machinery often operates according to specific parameters. Operators may need to know whether equipment is running, stopped, experiencing an alarm, or operating outside expected conditions.
A human machine interface can present this information through graphical screens, indicators, messages, and other visual elements. Operators can use the interface to observe machine conditions and, where the system permits, provide commands.
Typical applications include:
- Equipment Status
Operators can view whether selected machines are running or stopped.
- Parameter Monitoring
Important operating values can be displayed on the screen.
- Alarm Management
The interface can show alerts when configured conditions occur.
- Operator Controls
Depending on system design, authorised users can provide commands through the interface.
Identifying Energy Consumption Patterns
Energy consumption is not always consistent throughout the day. Different production schedules, equipment loads, and operating conditions can influence overall usage.
An Energy Management System can help organisations analyse consumption data over selected time periods. Comparing information can help teams understand recurring patterns and investigate unexpected changes.
Useful analysis may involve:
- Hourly consumption
- Daily consumption
- Weekly trends
- Production-period usage
- Peak demand patterns
This type of information can be particularly useful when organisations are reviewing operational practices and looking for opportunities to manage energy more effectively.
Applications in Agricultural Operations
Agricultural facilities can use electrical equipment for irrigation, pumping, ventilation, storage, processing, and other activities. Some systems may operate for extended periods, making energy monitoring useful for understanding operational consumption.
An energy monitoring solution can collect information from relevant electrical systems and present it in an organised format. Facility operators can then examine usage patterns and compare consumption across different operating periods.
Potential applications include:
- Irrigation systems
- Water pumping
- Agricultural processing
- Storage facilities
- Ventilation equipment
Digital monitoring can provide useful information for planning equipment operation and reviewing energy usage.
Supporting Infrastructure Management
Infrastructure facilities can contain multiple electrical and mechanical systems distributed across different areas. Lighting, pumping, ventilation, monitoring, and utility equipment may all contribute to total energy consumption.
Digital energy monitoring can help facility teams create a broader view of energy use. Information collected from different areas can be reviewed to understand consumption trends and identify unusual variations.
This can support activities such as:
- Monitoring facility-wide consumption
- Comparing different operational periods
- Reviewing equipment performance
- Identifying changes in demand
- Supporting maintenance planning
The exact capabilities depend on the equipment, sensors, communication infrastructure, and software used in the installation.
Supporting Operators During Automated Processes
Automated processes can involve multiple machines working according to programmed sequences. Operators still need access to information about the process and may need to respond when an alarm or unexpected condition occurs.
A human machine interface can act as the interaction point between operators and automated equipment. It can display process information in a structured visual format, helping users understand what is happening within the system.
Depending on the application, operators may be able to:
- Start or stop permitted processes
- View machine conditions
- Adjust authorised parameters
- Acknowledge alarms
- Review selected operating information
Access and control functions should be designed according to the requirements and safety considerations of the application.
Supporting Energy Efficiency Initiatives
Monitoring energy consumption is an important first step in understanding how resources are being used. Once reliable information is available, organisations can review their operating practices and evaluate possible efficiency measures.
An energy management solution can support this process by providing historical information and consumption trends. Teams can use these insights to investigate areas such as equipment scheduling, unnecessary operation, and changes in energy demand.
Potential areas for review include:
- Equipment Scheduling
Examining whether equipment operates only when required.
- Peak Demand
Understanding when energy demand reaches higher levels.
- Operational Patterns
Comparing energy use across different shifts or production periods.
- Equipment Performance
Investigating unexpected changes in consumption.
Better Decision-Making Through Visual Information
Complex operational data can be difficult to interpret when presented without context. Visual dashboards and structured displays can make important information easier to review.
A human machine interface can organise selected data into screens that are relevant to operators. Graphs, status indicators, numerical values, and alarm notifications can help users interpret equipment information according to their responsibilities.
This can be valuable in facilities where operators need to monitor several parameters while maintaining awareness of the wider process.
Integrating Energy and Operational Information
Energy data and equipment information can provide different perspectives on the same facility. Energy consumption may indicate how much electricity is being used, while machine data can provide information about equipment status and operation.
When these systems are appropriately integrated, organisations can gain a more connected view of their operations. This can support analysis of relationships between equipment activity and energy consumption.
Such integration can be useful for:
- Production monitoring
- Facility management
- Maintenance planning
- Energy analysis
- Operational reporting
The precise functionality depends on the architecture and compatibility of the installed systems.
Conclusion
Digital monitoring and operator interfaces can play an important role in modern electrical and industrial environments. An Energy Management System can help organisations monitor consumption, identify patterns, and analyse energy-related information, while a human machine interface can give operators a structured way to view equipment conditions and interact with authorised functions. These technologies have applications across industrial, commercial, agricultural, and infrastructure environments. Lauritz Knudsen Electrical & Automation supports India’s evolving electrical requirements across diverse sectors, backed by a legacy of more than 70 years and a 2.1-million-square-foot manufacturing footprint focused on advancing electrical solutions.


Leave a Reply